
Learn to make big conclusions about data sets by analyzing their mean, median, mode, and range using simple calculations.

Author
Tess Loucka
Published
March 2025


Learn to make big conclusions about data sets by analyzing their mean, median, mode, and range using simple calculations.

Author
Tess Loucka
Published
March 2025


Learn to make big conclusions about data sets by analyzing their mean, median, mode, and range using simple calculations.

Author
Tess Loucka
Published
May 2025


Key takeaways
Table of contents
Imagine this: you’re conducting a survey to determine how many pets your classmates have. You have 28 classmates and go around the room collecting data from each one. By the end, you have a lot of numbers written down!
Those numbers represent how many pets each classmate has—Amy has 2, Carl has 4, Becka has 0, etc.
However, if you want to expand on your findings and figure out things like the average number of pets people have in your class, the most common number of pets people have, and more, you’ll need to use mean, median, mode, and range.
In other words, these mathematical calculations allow people to analyze data sets and come to conclusions that can change the way they see the world! So, let’s walk through how and when to use them.
Measures of Central Tendency: Mean vs Median vs Mode
Mean, median, and mode summarize key information about the central tendency, or typical data, within a data set. This information can help mathematicians make predictions about data trends.
Mean, median, and mode each measure a different thing and are calculated using different formulas and techniques. So, what is mean, median, and mode?
Let’s talk about mean first!
“Mean” is “average.” Both mean the same thing! The mean of a data set is the average of the values in that data set. It is calculated by adding up all the values and dividing that number by the number of values present, giving you the center, or the average, of the data.
Mean is represented as x̅.
Median is the middle of a data set after the data has been organized in either ascending or descending order. Since median is the exact middle of a data set, 50% of the data is greater than the median and 50% is less than the median.
Median is represented as M.
Mode is the value in a data set that appears the most. Mode tells you what the most common value is within a larger set of values.
Mode is represented as Mo.
The range of a data set is the narrowest interval in which all the values of a data set fit. In other words, it is the difference between the smallest value and the largest value. It is not a representation of central tendency, but it is still a valuable measurement of a data set.
Range demonstrates the variability of a data set, or how different the data is.
No symbol represents range.
Unlock unlimited maths questions
Put your skills to the test with fun exercises + maths games that are proven to boost ability!
Want to learn more about the order of operations? DoodleMaths is an award-wining maths app that’s proven to double a child’s rate of progression with just 10 minutes of use a day!
Filled with fun, interactive questions covering the whole curriculum, it creates each child a unique work programme tailored to their needs, boosting their confidence and skills in maths. Try it free today!


Mean, median, mode, and range are all key measurements used in statistics to better understand a data set. In the real world, these measurements can have huge effects!
A company can calculate the mean revenue from each of its products or ads and base its future business ventures on that number, either continuing to make similar products and ads or changing its business model entirely.
A restaurant can calculate the mode of the dishes purchased by customers during a dinner rush to determine their most popular menu item. They can use this information to figure out how much of each ingredient they need to purchase in the future, as well as what sorts of dishes they should serve to be most successful.
One interesting fact you may hear on the news is that the average American family has 1.98 kids under 18. This may sound strange since you can’t actually have 1.98 kids. However, when talking about the average or mean of a data set, it’s normal to have decimal numbers.
Another example is salary! When people apply for jobs, they often want to know what the expected salary is first. You can calculate the median salary for a career in a certain field to inform yourself of what the typical salary in that field is.
Now that we know the BODMAS meaning, let’s discuss the BODMAS Rules.
The most important BODMAS Rule is when solving order of operation questions in maths, you must follow the order of the acronym.
Now that we know that mean, median, mode, and range are so important in mathematics and day-to-day life, let’s talk about how to calculate them!
To calculate mean, use the following formula:
Mean (x̅) = sum of values / number of values
Example:
You asked your family members how many books they read in one year. Your mom read 14, your dad read 11, your sister read 10, and your brother read 9. What is the mean number of books read by your family?
To calculate the mean, we will first add all the values: 14 + 11 + 10 + 9 = 44.
Next, we will divide 44 by the number of values present (4): 44/4 = 11.
Therefore, the mean number of books read by your family is 11. This means that, on average, your family members read about 11 books per year.
This does not mean your family members all read exactly 11 books per year, but it is an estimation of how many books they read.
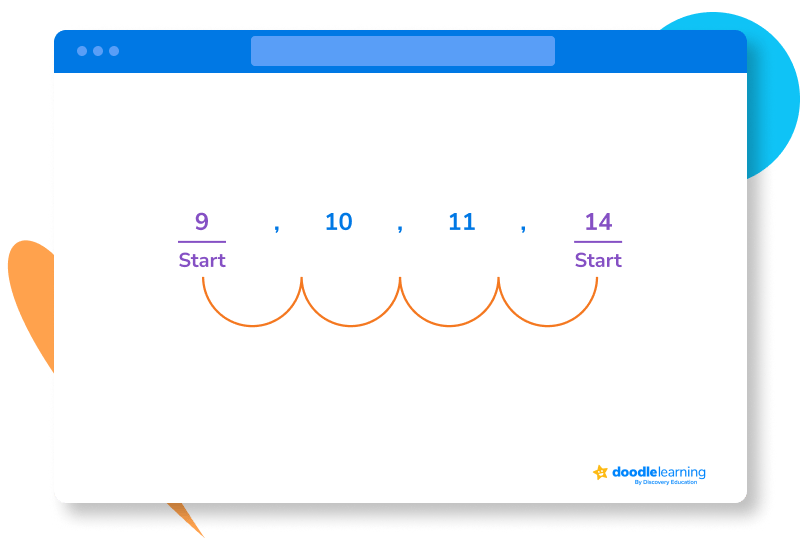
To calculate the median of a data set, organize all the values in ascending or descending order. Then, count inwards from both ends by 1 until you reach the centermost value.
Let’s use the same example from above about the number of books your family reads in a year.
Remember, your mom read 14, your dad read 11, your sister read 10, and your brother read 9.
To calculate the median number of books your family read, we first need to organize the values in order from either least to greatest or greatest to least. We’ll do least to greatest:
9, 10, 11, 14
The median is the middle of the set of values. To find the middle, we’ll start counting inwards from both ends.

Since the number of values in this data set is even (4), there is no middle value. To calculate the median, we have to take the mean of the two centermost values (10 and 11).
10 + 11 = 21
21/2 = 10.5
Therefore, the median number of books your family reads in one year is 10.5.
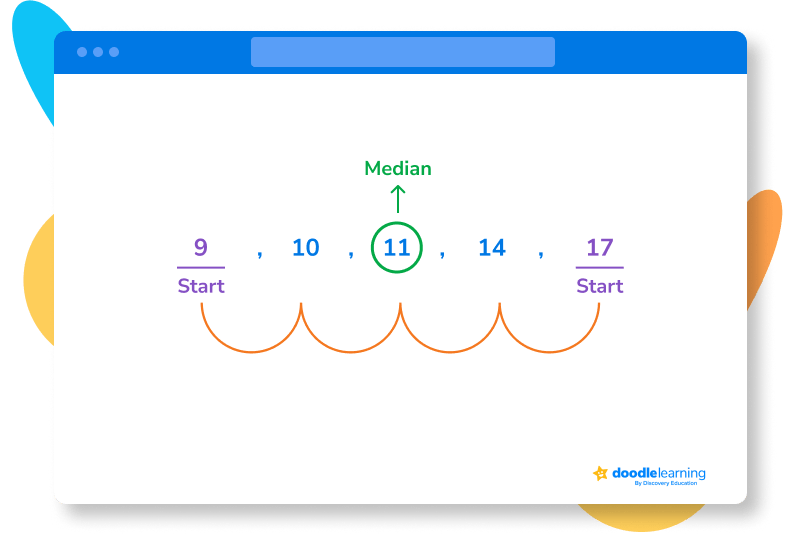
What if you had another sibling who read 17 books in a year? The new data set would be:
9, 10, 11, 14, 17
Let’s find the median.

To calculate mode, first organize your data set in ascending or descending order. Then, simply count how many times each value appears. The value that appears most is the mode.
Example:
You conduct a survey that collects data on how many movies each participant has watched within one month. The data you collect is as follows:
1, 4, 15, 1, 3, 9, 7, 1, 5, 9, 11, 0
To figure out the mode of this data set, first organize it. We’ll put it in ascending order:
0, 1, 1, 1, 2, 3, 4, 5, 7, 9, 9, 11, 15
As we can see, the number 1 appears the most out of all the other numbers. Therefore, 1 is the mode.
Data isn’t just numbers on a page; data explains the world around us and guides us in decision-making, affecting the actions of scientists, mathematicians, business owners, stock traders, and so many more.
Data gives us a window into how things work, and understanding and analyzing it is essential. Whether you’re just solving a problem on a math test, conducting a survey in your classroom, or making big business decisions at a company, mean, median, mode, and range are simple measurements that can lead to new and exciting discoveries.
Try DoodleMaths for free!
Select a year group
Scroll down for the answers!
1. What is the mode of the following data set?
6, 4, 1, 1, 2, 6, 8, 6, 3, 6, 8, 6
A. 1
B. 6
C. 8
D. 3
2. Susan ate 3 cookies, Max ate 7 cookies, Martha ate 5 cookies, and Sam ate 14 cookies.
A. 7.25, and there is not an outlier
B. 6.5, and there is not an outlier
C. 6.5, and there is an outlier
D. 7.25, and there is an outlier
3. You conduct a survey to collect data on the number of TVs the average household in your neighborhood has. The results are as follows:
1, 2, 4, 2, 1, 3, 2, 2, 3, 0, 1, 0, 2
What is the median number of TVs households in your neighborhood have?
A. 2
B. 1
C. 0
D. 3

Parents, sign up for a DoodleMaths subscription and see your child become a maths wizard!

B) The mode is 6 because 6 is the value that appears the most.
D) The mean is 7.25 and yes, there is an outlier. The outlier is 14 because it is much larger than every other value.
A) The median is 2 because it is the centermost value.
Book a chat with our team
If you’d like to use Doodle’s browser version, please visit this page on a desktop.
To log in to Doodle on this device, you can do so through our apps. You can find out how to download them here: