DoodleEnglish updates
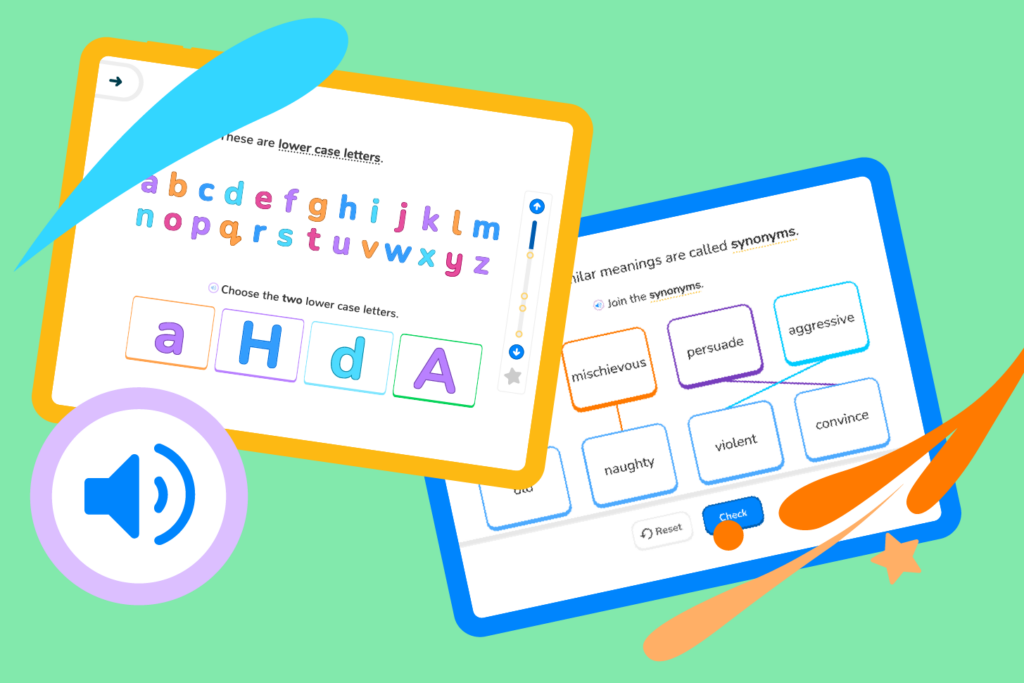
Learn what’s taught in the Year 1 English Curriculum across the subjects of reading, comprehension, writing, composition, and grammar.
Learn what’s taught in the Year 1 English Curriculum across the subjects of reading, comprehension, writing, composition, and grammar.
In this blog, we explore the latest exciting innovations made to our Doodle programmes!

The key to success isn’t just meeting expectations, but exceeding them! In this blog, we explore some of our most exciting Doodle updates.
The key to success isn’t just meeting expectations, but exceeding them! In this blog, we explore some of our most exciting Doodle updates.

The Winter Calendar is here! Earn exclusive rewards by Doodling ‘little and often’ throughout December AuthorLucy Hart Last updatedNovember 2024

A summary of a recent study conducted by our team investigating the link between DoodleEnglish usage and academic progression. Abstract
Post last updated: 8th of November 2024 Kick-start positive learning habits this school year with our back-to-school badges, exclusive virtual

A summary of a study conducted by Bill Smith, a PhD student, investigating the link between DoodleMaths usage and academic

Crafted by our team of education specialists, Doodle’s baseline assessment mode is now more accurate and streamlined than ever before.

Here at Doodle, we believe that education is the key to opportunity. Our mission is to empower children to achieve

Sometimes asking your class to login to DoodleMaths during lesson time can be more hassle than it’s worth, which is